


 Tech & IT
 Business
 Coding & Developer
 Finance & Accounting
 Academics
 Office Applications
 Art & Design
 Marketing
 Health & Wellness
 Sounds & Music
 Lifestyle
 Photography
More Learnfly
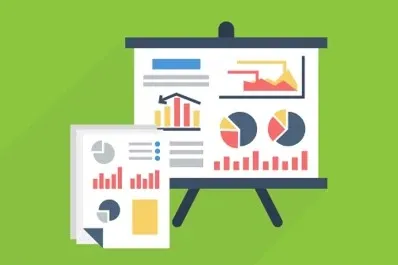
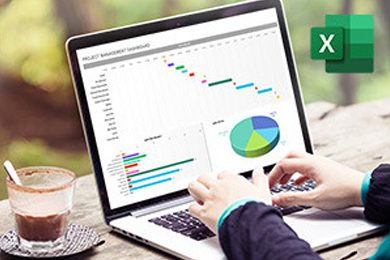
Business Solution Become an InstructorExcel dashboards are visual representations of data that provide a quick overview of key metrics and trends. Using charts, graphs, and tables, Excel dashboards enable users to analyze complex datasets, track performance, and make informed decisions in a visually accessible format.
By : Rahim Zulfiqar Ali
Microsoft Excel Course for Data & Business Analytics (Basic to Advanced)...
4 1247
4:29:45 hrs 46 lectures All Level
By : Kathryn Tilley
A course for complete beginners on how to use conditional formatting in Excel...
4 1085
8 lectures All Level
By : Kathryn Tilley
A course for complete beginners on how to add, subtract, multiply and divide data in ...
4.3 793
6 lectures Beginner Level
By : Rajesh Vydhala
Learn all about Conditional Formatting, An accelerated, step-by-step program for Cond...
4.4 9097
23 lectures All Level
By : Rajesh Vydhala
Become a Master in Excel Tables...
4.2 89750
25 lectures All Level
By : Wesam Qawasmeh
2021 Master Basic and Advanced Microsoft Excel Skills Through fast Excel Tutorials...
4.1 58629
78 lectures All Level
By : Prashant Panchal
Accounting for Fixed Assets & Depreciation with a Robust Excel Model to derive/foreca...
4.1 79752
1:1:30 hrs 16 lectures Intermedite Level
By : Gaurav T
Basic functions, advanced functions, look up functions, data analytics tool, formatti...
4.8 73338
5 lectures Beginner Level
By : Chip Reaves
How To Take Full Advantage of Office 365: A Foundational New Tool For Modern Business...
4.8 82656
11:35:57 hrs 70 lectures Beginner Level


 Jazeb Akram
 4.2 771056 Beginner Level

 John Hedengren
 4.1 568974 All Level

 Ranjan Pandey
 4.1 346663 All Level

 Muhammad Ahsan Pervaiz
 4.2 101264 All Level

 Pieter Vliegenthart
 4.6 100853 All Level

 Jerome P.
 4.8 100774 All Level

 Vikas Munjal
 4.8 100008 Beginner Level

 Senol Atac
 4.9 99987 All Level

 Avinash A
 4.8 99903 All Level

 Sekhar Metla (Microsoft Certified Professional) Sudha
54 Lectures Beginner Level
.jpg)
 AKHIL VYDYULA
58 Lectures Beginner Level
.jpg)
 AKHIL VYDYULA
50 Lectures Beginner Level

 Biz Facility
 4 Lectures Beginner Level

 Biz Facility
 22 Lectures Beginner Level

 Biz Facility
 5 Lectures Beginner Level
_11zon_(1) (1).jpg)
 AKHIL VYDYULA
5 Lectures Beginner Level
 Pamch Tutor M.Ed
81 Lectures Beginner Level
 Ashis Mondal
31 Lectures Beginner Level
 Nikhil Lakhyani
 75 Lectures Beginner Level

20 Lectures Beginner Level
.jpg)
 Nhoeb Khan
46 Lectures Beginner Level
.jpg)
 Fredrick Ezeh
28 Lectures Beginner Level
.jpg)
 Fredrick Ezeh
36 Lectures Beginner Level
.jpg)
 Fredrick Ezeh
59 Lectures Beginner Level
.jpg)
 Fredrick Ezeh
53 Lectures Beginner Level
 Sahil Hasija
17 Lectures Beginner Level

 Prof. M. Higazi
20 Lectures Beginner Level

 AWESOME EMMANUEL
27 Lectures Beginner Level
 AWESOME EMMANUEL
47 Lectures Beginner Level
 Anshuman Tandon
20 Lectures Beginner Level

 Stephen Saxton
66 Lectures Beginner Level
 Anna Clark
60 Lectures Beginner Level

 Kamarthi Karthik
38 Lectures Beginner Level
 Stephen Saxton
36 Lectures Beginner Level

 ISAAC D GOTTLIEB
41 Lectures Beginner Level
 LEMMY FRANCISCO KAWONGA
 85 Lectures Beginner Level
 Stephen Saxton
42 Lectures Beginner Level

 Gerasimos Magoulas
13 Lectures Beginner Level
 Gerasimos Magoulas
10 Lectures Beginner Level

 Binary CodeSoft
 8 Lectures Beginner Level
 Binary CodeSoft
 9 Lectures Beginner Level
 Asif Hafeez
28 Lectures Beginner Level
 Widhi Muttaqien
87 Lectures Beginner Level

 Sarmad Jadoon
 93 Lectures Beginner Level
 Sarfaraz Mohammed
6 Lectures Beginner Level
 Sarfaraz Mohammed
51 Lectures Beginner Level
 AllQuant .
35 Lectures Beginner Level
 LinCademy Training
19 Lectures Beginner Level
 Sekhar Metla (Microsoft Certified Professional) Sudha
135 Lectures Beginner Level
 LinCademy Training
26 Lectures Beginner Level

 LinCademy Training
20 Lectures Beginner Level
 Sanjay Kumar Singh
35 Lectures Beginner Level
 Sanjay Kumar Singh
17 Lectures Beginner Level
 Atul Kadlag
101 Lectures Beginner Level
 Sanjay Kumar Singh
27 Lectures Beginner Level

 Muhammad Ismail
26 Lectures Beginner Level
.jpg)
 Muhammad Ismail
41 Lectures Beginner Level

 Muhammad Ismail
27 Lectures Beginner Level
 Sekhar Metla (Microsoft Certified Professional) Sudha
57 Lectures Beginner Level

 Usama Hassan
27 Lectures Beginner Level

 Rahim Zulfiqar Ali
20 Lectures Beginner Level
 Pradeep Raj
28 Lectures Beginner Level
 Kerron Duncan
81 Lectures Beginner Level

 Paul Eastwood Harris
40 Lectures Beginner Level

 Satyajit Pattnaik
18 Lectures Beginner Level
 Ismaila Omeiza Mumuni
137 Lectures Beginner Level
 Ismaila Omeiza Mumuni
161 Lectures Beginner Level

 Rahim Zulfiqar Ali
46 Lectures Beginner Level

 Theodore Petrou
36 Lectures Beginner Level

 Theodore Petrou
28 Lectures Beginner Level
 SkillsOnDemand .
10 Lectures Beginner Level
 SkillsOnDemand .
12 Lectures Beginner Level
 Satyajit Pattnaik
32 Lectures Beginner Level

 Kathryn Tilley
8 Lectures Beginner Level

 Ahmad Sharifzadeh
45 Lectures Beginner Level
 Kathryn Tilley
12 Lectures Beginner Level

 Amey Karambelkar
20 Lectures Beginner Level

 Junaid Ahmed
70 Lectures Beginner Level
 Bhollamanbhavani
 42 Lectures Beginner Level
 Arthur Fong
39 Lectures Beginner Level
 Namita Devi
22 Lectures Beginner Level

 Arthur Fong
50 Lectures Beginner Level
 Daniel Alexandru Petrescu
15 Lectures Beginner Level
 Daniel Alexandru Petrescu
10 Lectures Beginner Level

 Jan Ekhteyari
70 Lectures Beginner Level
 Rajesh Vydhala
75 Lectures Beginner Level

 Mohammed Marwan
 16 Lectures Beginner Level
 Nikolai Schuler
 137 Lectures Beginner Level

 Kathryn Tilley
6 Lectures Beginner Level

 Jan Ekhteyari
46 Lectures Beginner Level
 Engr. M Khalid Husain .
13 Lectures Beginner Level

 Rajesh Vydhala
23 Lectures Beginner Level
 SkillsOnDemand .
54 Lectures Beginner Level
 Chandramouli Jayendran
158 Lectures Beginner Level

 Jan Ekhteyari
61 Lectures Beginner Level

 Rajesh Vydhala
25 Lectures Beginner Level
 Jan Ekhteyari
72 Lectures Beginner Level
 SkillsOnDemand .
48 Lectures Beginner Level

 Chandramouli Jayendran
24 Lectures Beginner Level
 Chandramouli Jayendran
59 Lectures Beginner Level

 Wesam Qawasmeh
78 Lectures Beginner Level
 Haytham Elmousalami
14 Lectures Beginner Level

 Rahim Zulfiqar Ali
14 Lectures Beginner Level

 Rahim Zulfiqar Ali
12 Lectures Beginner Level
 Juan Galvan
150 Lectures Beginner Level
 Florian Fiducia
189 Lectures Beginner Level
 Prashant Panchal
74 Lectures Beginner Level
 Prashant Panchal
23 Lectures Beginner Level

 Prashant Panchal
16 Lectures Beginner Level

 SRINIVAS REDDY EXCELMAP
45 Lectures Beginner Level
 SRINIVAS REDDY EXCELMAP
65 Lectures Beginner Level
 MEHDI OUMOUSS OUMOUSS
23 Lectures Beginner Level
 Abdelrahman Abdou
119 Lectures Beginner Level

 Ross Maynard
21 Lectures Beginner Level

 Taylor Croonquist
36 Lectures Beginner Level
 Vardges Zardaryan
36 Lectures Beginner Level
 Datahill Solutions
19 Lectures Beginner Level

 Datahill Solutions
11 Lectures Beginner Level

 Gaurav T
5 Lectures Beginner Level

 Anurag Singal
12 Lectures Beginner Level
 Vardges Zardaryan
61 Lectures Beginner Level

 Prof. K Krahenbill
45 Lectures Beginner Level

 Brian Jackson
25 Lectures Beginner Level
 Brian Jackson
7 Lectures Beginner Level

 Brian Jackson
114 Lectures Beginner Level

 Brian Jackson
34 Lectures Beginner Level
 Muhammad Ali Yasin
16 Lectures Beginner Level

 Chip Reaves
70 Lectures Beginner Level
 Daniele Protti
66 Lectures Beginner Level

 Daniele Protti
223 Lectures Beginner Level
 Deepesh Vashistha
41 Lectures Beginner Level

 Phikolomzi Gugwana
25 Lectures Beginner Level
An Excel Dashboard is a visual representation of data that provides a concise and interactive overview of key performance indicators (KPIs) and critical metrics. It often includes charts, graphs, and other visual elements for quick data analysis.
To create a dashboard, organize your data, select relevant KPIs, and create charts or graphs. Arrange these elements on a single sheet for a clear and comprehensive view. Use features like slicers and interactive controls for user-friendly navigation.
Excel Dashboards can incorporate various data visualizations, such as:
Charts and Graphs: Bar charts, line graphs, pie charts, etc.
Gauges and Speedometers: Visualize performance against predefined targets.
Tables and Sparklines: Display data trends and summaries.
Maps: Geospatial representations for location-based data.
Excel Dashboards provide a quick and visually appealing way to interpret complex data. Decision-makers can gain insights, identify trends, and make informed decisions based on the visualizations presented in the dashboard.
Yes, Excel Dashboards can be shared by saving the workbook or specific sheets and sending them via email or through collaboration platforms. You can also export dashboards as PDFs for wider distribution.


