This plan includes
- Limited free courses access
- Play & Pause Course Videos
- Video Recorded Lectures
- Learn on Mobile/PC/Tablet
- Quizzes and Real Projects
- Lifetime Course Certificate
- Email & Chat Support
What you'll learn?
- Learn how to analyze and design a well presentable dashboard for organizations and businesses
- You will learn how to Monetize your Excel Dashboard skill and make money working as a freelancer or an In-House Data analyst
- You will learn how to use Excel formulas and Pivot Table successfully
- You will learn Excel Power Query for data cleaning and transformation
- You will learn how to design modern dashboards
- You will learn how to use Power Pivot to manage huge rows of data without breaking down
- You will learn how to use DAX measures to speed up analysis and create dashboards
- How to create your portfolio (Online presence)
- How to receive payment from clients
- How to approach clients project
Course Overview
This course will take you beyond your expectations, I have put together all you need to master data analytics and dashboard creation. We use real-life datasets that are companies and industry standards.
You will learn from my years of experience as an analyst, data analytics freelancer, and as well learn how to monetize your data analytics skills and make money from them.
We have more projects in this course than you can ever find from other instructors (courses) on this platform. We illustrated all projects using a real-life dataset that applied to day-to-day business activities.
All the dashboards taught in these classes are not only dynamic and interactive but all so have outstanding designs.
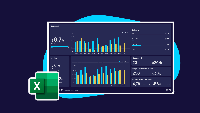
By participating in this Microsoft Excel Dashboard course you'll gain the widely sought-after skills necessary to analyze enormous datasets.
You will learn Power Query for data cleaning and transformations, Power Pivot to handle huge datasets like millions of rows of data and have it analyzed in Excel.
You learn how to manipulate data with DAX language in Power Pivot and as well create easy relationships between multiple tables instead of using basic lookups that might slow your analytics down.
Join us today to create your own stories and help businesses make accurate decisions.
Pre-requisites
- No pervious programming or Excel knowledge is needed. We got you cover from the scratch to the advance level of the course.
- Just Microsoft Excel
- Excel 2016, Excel 2019 or Excel 365
Target Audience
- This course is for those that are trying to grab a career in Data
- If you want to become a successful Data Analyst Freelancer or an In-House Data Analyst this course is for you
- If you want to a create colorful and never seen Excel Dashboard designs before, this course is for you
Curriculum 137 Lectures 14:33:31
Section 1 : Watch me First
- Lecture 2 :
- How to use practice files
- Lecture 3 :
- How to create dashboard that updates dynamically
- Lecture 4 :
- Getting Icons for your Projects
- Lecture 5 :
- How to pick colors for your projects
- Lecture 6 :
- Update broken links
- Lecture 7 :
- What Excel Understands
- Lecture 8 :
- How to handle errors in power query before you start
Section 2 : Week 1 Personal Expenses Dashboard
- Lecture 1 :
- Introduction
- Lecture 2 :
- Data cleaning and transformations
- Lecture 3 :
- Creating dashboard layout
- Lecture 4 :
- Expenses flows
- Lecture 5 :
- Creating cash outflow and inflows
- Lecture 6 :
- Cards KPI
- Lecture 7 :
- Monthly expenses analysis
- Lecture 8 :
- Integrating and formatting filters
Section 3 : Week 2 Dashboard for shipping status
- Lecture 1 :
- Introduction
- Lecture 2 :
- Saving your project
- Lecture 3 :
- Data Cleaning and Transformations
- Lecture 4 :
- Creating Dashboard Layout
- Lecture 5 :
- Shipping insight by orders
- Lecture 6 :
- Unique Sorting
- Lecture 7 :
- Visualizing Sorted Table
- Lecture 8 :
- Transition chart
- Lecture 9 :
- Comparing Qty ordered and received orders
- Lecture 10 :
- More KPI
- Lecture 11 :
- Conditional formatting
- Lecture 12 :
- Format slicers
Section 4 : Week 3 Sales Analysis Dashboard
- Lecture 1 :
- Intro
- Lecture 2 :
- Connecting to an External Data and Cleaning
- Lecture 3 :
- Creating the Dashboard Environment
- Lecture 4 :
- Populating Visual cards
- Lecture 5 :
- Saving with the Right Extension
- Lecture 6 :
- Monthly and Quarterly analysis Details
- Lecture 7 :
- Added Conditional Column with Power Query
- Lecture 8 :
- Creating Shipping Interval Analysis
- Lecture 9 :
- Shipping Interval charts
- Lecture 10 :
- Sales Channel and Products Analysis
- Lecture 11 :
- Filter Connection and Formatting
Section 5 : Week 4 Profit Analysis Dashboard
- Lecture 1 :
- Intro
- Lecture 2 :
- How to Handle Multiple Errors in Power Query
- Lecture 3 :
- Connecting and Transforming Data
- Lecture 4 :
- Writing DAX in Power Pivot
- Lecture 5 :
- Creating Dashboard Layout
- Lecture 6 :
- Creating New Measures for KPI
- Lecture 7 :
- Getting Values for Cards Using Name Ranges
- Lecture 8 :
- Creating KPI Cards
- Lecture 9 :
- Creating Monthly Trend
- Lecture 10 :
- Creating Custom Number formatting
- Lecture 11 :
- Creating Profit Analysis Charts
- Lecture 12 :
- Getting Values for our Charts
- Lecture 13 :
- Adding Percentages
- Lecture 14 :
- Creating Monthly Profit Chart
- Lecture 15 :
- Quarterly Analysis Chart
- Lecture 16 :
- Transition Chart Between Top and Bottom Buyers
- Lecture 17 :
- Formatting Values for Top and Bottom
- Lecture 18 :
- Creating Cumulative Analysis
- Lecture 19 :
- Adding Filters
- Lecture 20 :
- Finally Formatting
Section 6 : Week 5 Cancer Mortality Dashboard
- Lecture 1 :
- Introduction
- Lecture 2 :
- Creating Homepage Dashboard
- Lecture 3 :
- Creating Age Group Cards
- Lecture 4 :
- Adding Images to the Cards
- Lecture 5 :
- Main Dashboard
- Lecture 6 :
- Filling up Cards with Values
- Lecture 7 :
- Creating Custom Comparison Line Chart
- Lecture 8 :
- Comparison Line Chart Summary
- Lecture 9 :
- Formatting Comparison Chart
- Lecture 10 :
- Matching the Filter with Dashboard Colors
- Lecture 11 :
- Creating A Dynamic Caption
- Lecture 12 :
- Cancer that Affect Under Age Analysis
- Lecture 13 :
- Creating one More Caption
- Lecture 14 :
- Gender Analysis
Section 7 : Week 6 Hr Dashboard
- Lecture 1 :
- Intro
- Lecture 2 :
- Transform Data with Power Query
- Lecture 3 :
- Saving your Project
- Lecture 4 :
- Creating Name Multiple Ranges from Headers
- Lecture 5 :
- Promotional Analysis
- Lecture 6 :
- Creating the Dashboard Layout
- Lecture 7 :
- Departmental Analysis
- Lecture 8 :
- Gender Details Analysis
- Lecture 9 :
- How to Update this Dashboard
- Lecture 10 :
- Marital Status Analysis
- Lecture 11 :
- Job Types Analysis
- Lecture 12 :
- Transition Chart between Total Employees and Employees Salary
- Lecture 13 :
- Cards for Educational Background
- Lecture 14 :
- Display and Hide cards with Values
- Lecture 15 :
- Educational and Gender Breakdown
- Lecture 16 :
- Creating Gender Card
- Lecture 17 :
- Integrating filters
- Lecture 18 :
- Employees Promotional Analysis
- Lecture 19 :
- Visualizing Promotional Analysis
Section 8 : Week 7 Migration insight Dashboard
- Lecture 1 :
- Intro to dashboard
- Lecture 2 :
- Creating Dashboard Layout
- Lecture 3 :
- Using Normal Savings
- Lecture 4 :
- Gender Analysis
- Lecture 5 :
- Monthly Migration Analysis
- Lecture 6 :
- Visa type by Immigration
- Lecture 7 :
- Final and Provisional Analysis
- Lecture 8 :
- Making Fancy Filters
Section 9 : Week 8 Order analysis Dashboard
- Lecture 1 :
- Intro
- Lecture 2 :
- Dashboard Layout
- Lecture 3 :
- Adding Values To Top Cards
- Lecture 4 :
- KPI and Trend lines
- Lecture 5 :
- 5 Conditional messages and captions
- Lecture 6 :
- Customizing Search Results
- Lecture 7 :
- Making search dynamic with captions
- Lecture 8 :
- Visualizing Search Results
- Lecture 9 :
- Visualizing Search Results Messages
- Lecture 10 :
- Show if any Filter is Selected
- Lecture 11 :
- Matching the Slicers with the Background
- Lecture 12 :
- Products Line Dashboard
- Lecture 13 :
- Adding 3D images and values
- Lecture 14 :
- Final Touches and Formatting
Section 10 : Week 9 Online store sales Dashboard
- Lecture 1 :
- Intro
- Lecture 2 :
- Transforming Data and Splitting Columns in Power Query
- Lecture 3 :
- Dashboard Environment
- Lecture 4 :
- Time Rages Card
- Lecture 5 :
- Creating Cards Types Visual Card
- Lecture 6 :
- Analyzing Card Values
- Lecture 7 :
- Visualizing Card Analyzed Values
- Lecture 8 :
- Dynamic Custom Bar Chart for Card Types
- Lecture 9 :
- Time Range Percentages Cards
- Lecture 10 :
- Analyzing Time Rang
- Lecture 11 :
- Best Selling Days
- Lecture 12 :
- Selling Time Analysis Chart
- Lecture 13 :
- Weekdays Analysis
- Lecture 14 :
- Creating Best Selling Time Range
- Lecture 15 :
- Formatting our Dashboard
- Lecture 16 :
- Creating Top selling Location Base on the Filter Selected
Section 11 : Bonus Dashboard
- Lecture 1 :
- Bonus
Section 12 : How to Monetize your Analytics and Dashboard Skills
- Lecture 1 :
- How to monetize Excel skill
- Lecture 2 :
- How to connect WhatsApp for business to your portfolio
- Lecture 3 :
- How to communicate with clients if given an offer
- Lecture 4 :
- What about clients that can't speak and write in English
- Lecture 5 :
- Is there a big opportunity for as an excel users
- Lecture 6 :
- How to receive payment as a freelancer
Our learners work at
Frequently Asked Questions
How do i access the course after purchase?
It's simple. When you sign up, you'll immediately have unlimited viewing of thousands of expert courses, paths to guide your learning, tools to measure your skills and hands-on resources like exercise files. There’s no limit on what you can learn and you can cancel at any time.Are these video based online self-learning courses?
Yes. All of the courses comes with online video based lectures created by certified instructors. Instructors have crafted these courses with a blend of high quality interactive videos, lectures, quizzes & real world projects to give you an indepth knowledge about the topic.Can i play & pause the course as per my convenience?
Yes absolutely & thats one of the advantage of self-paced courses. You can anytime pause or resume the course & come back & forth from one lecture to another lecture, play the videos mulitple times & so on.How do i contact the instructor for any doubts or questions?
Most of these courses have general questions & answers already covered within the course lectures. However, if you need any further help from the instructor, you can use the inbuilt Chat with Instructor option to send a message to an instructor & they will reply you within 24 hours. You can ask as many questions as you want.Do i need a pc to access the course or can i do it on mobile & tablet as well?
Brilliant question? Isn't it? You can access the courses on any device like PC, Mobile, Tablet & even on a smart tv. For mobile & a tablet you can download the Learnfly android or an iOS app. If mobile app is not available in your country, you can access the course directly by visting our website, its fully mobile friendly.Do i get any certificate for the courses?
Yes. Once you complete any course on our platform along with provided assessments by the instructor, you will be eligble to get certificate of course completion.
For how long can i access my course on the platform?
You require an active subscription to access courses on our platform. If your subscription is active, you can access any course on our platform with no restrictions.Is there any free trial?
Currently, we do not offer any free trial.Can i cancel anytime?
Yes, you can cancel your subscription at any time. Your subscription will auto-renew until you cancel, but why would you want to?
Instructor

2744 Course Views
2 Courses


 Tech & IT
 Business
 Coding & Developer
 Finance & Accounting
 Academics
 Office Applications
 Art & Design
 Marketing
 Health & Wellness
 Sounds & Music
 Lifestyle
 Photography


