This plan includes
- Limited free courses access
- Play & Pause Course Videos
- Video Recorded Lectures
- Learn on Mobile/PC/Tablet
- Quizzes and Real Projects
- Lifetime Course Certificate
- Email & Chat Support
What you'll learn?
- You will learn to create 6 Dynamic Excel Dashboard
- You will learn about Pivot Tables and Pivot Chart
- You will learn how to Design, Format and Style Data Elements
- Learn the Concepts of How to Create and Design an Interactive Excel Dashboard for your department.
Course Overview
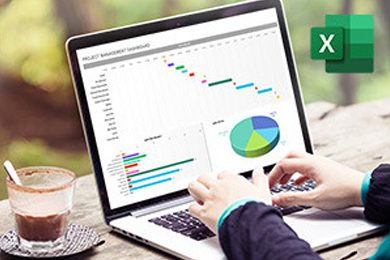
Learn Data Analysis and Data Visualization with Excel Dashboard. In this course we will cover topics like Excel Data Analysis and Data Visualization with Excel Pivot Tables, Excel Pivot Charts and 6 Interactive and 6 Dynamic Excel Dashboards. You can use either Microsoft Excel 2010, Excel 2013, Excel 2016 or Excel 2019 for this learning.
Excel Charts and Excel Graphs are one of most powerful features of Microsoft Excel which allows the users to represent numerical data in Graphical Data Visualization format so that end user gets a better view of the Information discussed.
In this course
You will learn the Excel Pivot Table and Excel Pivot Chart Function in detail and you will learn how to create Dynamic Excel Charts and Excel Graphs.
You will Learn to create 6 Dynamic Sales Dashboard in Excel
You will learn how to design, style and format aspects of Excel 2016 are applied on Excel charts
You will use the dynamic graphical representation to display your complex data in an impressive way.
This Course is structured in 30 Plus chapters and you will learn all the aspects of Excel Dashboard in depth .
We will go through, steps in detail to create 6 Dynamic Excel Dashboards using Charts, Design and Style Elements.
Invest In Yourself, Take a decision Today, Start Learning Data Analysis
So Let the Show begin!
Pre-requisites
- Basic Excel Knowledge
- This Course is created on Excel 2016, You can also use Excel 2010 and above
- Interest to Learn and Upgrade Your Skillset
- A Windows PC where Microsoft Excel is Installed
Target Audience
- If you are looking to improve your Microsoft Excel Skills
- If you want to learn how to create Excel Charts, Formulas and Functions and Excel Shortcuts
- If you want to learn foundation of how to create Excel Dynamic Dashboards
- If you create Management Reports or MIS
- Excel users who have basic skills but would like to become more proficient in data exploration and analysis
- Anyone who works with Excel on a regular basis
Curriculum 48 Lectures 05:01:57
Section 1 : Learn the Basics of Excel Dashboard
- Lecture 2 :
- Quickly Download Course Files and Let's get Started.
Section 2 : Learn to Create a Dynamic Microsoft Excel Sales Dashboard - Project 1 of 6
- Lecture 1 :
- Create Pivot Tables to Categorize Data for creating Pivot Charts & Dashboards
- Lecture 2 :
- Create Pivot Charts to represent your data in a Dynamic Dashboard
- Lecture 3 :
- Add Design & Style , Slicers, Time Line, Gender Charts etc in Sales Dashboard
Section 3 : Learn to Create a Dynamic Microsoft Excel Sales Dashboard - Project 2 of 6
- Lecture 1 :
- Create Pivot Tables , to categorize & Structure your data to create Pivot Charts
- Lecture 2 :
- Create Pivot Charts and Slicers & add Design & Style Elements to Your Dashboard.
Section 4 : Learn to Create a Dynamic Microsoft Excel Sales Dashboard - Project 3 of 6
- Lecture 1 :
- Create an Excel Dashboard that shows product Sales of two Brands over the years
- Lecture 2 :
- Excel Charts for Interactive Excel Dashboard 1
- Lecture 3 :
- Excel Charts for Interactive Excel Dashboards
- Lecture 4 :
- Excel Slicers for Interactive Excel Dashboard
Section 5 : Create a Dynamic HR Dashboard - Project 4 of 6
- Lecture 1 :
- Excel Pivot Table and Excel Pivot Chart that display Employees by Gender details
- Lecture 2 :
- Excel Pivot Table & Excel Pivot Chart to display Employees by Department details
- Lecture 3 :
- Excel Pivot Table & Excel Pivot Chart to display Employee Hire types details
- Lecture 4 :
- Excel Pivot Table & Pivot Chart to display Employee Status (Active/Inactive)
- Lecture 5 :
- Excel Pivot Table & Excel Pivot Chart to display Employee Designation Types
- Lecture 6 :
- Excel Pivot Table & Pivot Chart to display Employee Expense by all departments
- Lecture 7 :
- Excel Pivot Table & Pivot Chart to display Employee Expense by all departments
- Lecture 8 :
- Pivot Table & Pivot Chart to display Average Sick Leaves (Various Departments)
- Lecture 9 :
- Pivot Table & Pivot Chart to display Average Employee Rating -Various Department
- Lecture 10 :
- Make Your Chart dynamic and interactive using Excel Slicers, Design & Style
Section 6 : Create a Dynamic Web Analytics Dashboard - Project 5 of 6
- Lecture 1 :
- Introduction to Excel Dashboard tutorial
- Lecture 2 :
- Data used in this Dashboard
- Lecture 3 :
- Create your first Excel Pivot Table and Pivot Chart for Dynamic Dashboard
- Lecture 4 :
- Create your second Excel Pivot Table and Pivot Chart for Dynamic Dashboard
- Lecture 5 :
- Create your third Excel Pivot Table and Pivot Chart for Dynamic Dashboard
- Lecture 6 :
- Create your fourth Excel Pivot Table and Pivot Chart for Dynamic Dashboard
- Lecture 7 :
- Create your fifth Excel Pivot Table and Pivot Chart for Dynamic Dashboard
- Lecture 8 :
- Create your sixth Excel Pivot Table and Pivot Chart for Dynamic Dashboard
- Lecture 9 :
- Create your seventh Excel Pivot Table and Pivot Chart for Dynamic Dashboard
- Lecture 10 :
- Create your eighth Excel Pivot Table and Pivot Chart for Dynamic Dashboard
- Lecture 11 :
- Create your ninth Excel Pivot Table and Pivot Chart for Dynamic Dashboard
- Lecture 12 :
- Create your tenth Excel Pivot Table and Pivot Chart for Dynamic Dashboard
- Lecture 13 :
- Make Excel Dashboards, dynamic using dynamic excel dynamic shapes
- Lecture 14 :
- Make Excel Dashboards, dynamic using dynamic excel slicers
Section 7 : Create a Dynamic HR Dashboard - Project 6 of 6
- Lecture 1 :
- Let's Learn how to create an interactive and dynamic Excel HR Dashboard
- Lecture 2 :
- Create your first Pivot Table and Pivot Chart for your Interactive Dashboard
- Lecture 3 :
- Create your second Pivot Table and Pivot Chart for your Interactive Dashboard
- Lecture 4 :
- Create your third Pivot Table and Pivot Chart for your Interactive Dashboard
- Lecture 5 :
- Create your fourth Pivot Table and Pivot Chart for your Interactive Dashboard
- Lecture 6 :
- Create your fifth Pivot Table and Pivot Chart for your Interactive Dashboard
- Lecture 7 :
- Create your sixth Pivot Table and Pivot Chart for your Interactive Dashboard
- Lecture 8 :
- Create your seventh Pivot Table and Pivot Chart for your Interactive Dashboard
- Lecture 9 :
- Create your Eighth Pivot Table and Pivot Chart for your Interactive Dashboard
- Lecture 10 :
- Create your ninth Pivot Table and Pivot Chart for your Interactive Dashboard
- Lecture 11 :
- Make Your Chart dynamic and interactive using Excel Slicers, Design & Style
- Lecture 12 :
- Conclusion
Section 8 : Thank You for taking up this course and Upgrading Your Skillset.
- Lecture 1 :
- You have mastered the skills to create 6 Interactive Excel Dashboards
Our learners work at
Frequently Asked Questions
How do i access the course after purchase?
It's simple. When you sign up, you'll immediately have unlimited viewing of thousands of expert courses, paths to guide your learning, tools to measure your skills and hands-on resources like exercise files. There’s no limit on what you can learn and you can cancel at any time.Are these video based online self-learning courses?
Yes. All of the courses comes with online video based lectures created by certified instructors. Instructors have crafted these courses with a blend of high quality interactive videos, lectures, quizzes & real world projects to give you an indepth knowledge about the topic.Can i play & pause the course as per my convenience?
Yes absolutely & thats one of the advantage of self-paced courses. You can anytime pause or resume the course & come back & forth from one lecture to another lecture, play the videos mulitple times & so on.How do i contact the instructor for any doubts or questions?
Most of these courses have general questions & answers already covered within the course lectures. However, if you need any further help from the instructor, you can use the inbuilt Chat with Instructor option to send a message to an instructor & they will reply you within 24 hours. You can ask as many questions as you want.Do i need a pc to access the course or can i do it on mobile & tablet as well?
Brilliant question? Isn't it? You can access the courses on any device like PC, Mobile, Tablet & even on a smart tv. For mobile & a tablet you can download the Learnfly android or an iOS app. If mobile app is not available in your country, you can access the course directly by visting our website, its fully mobile friendly.Do i get any certificate for the courses?
Yes. Once you complete any course on our platform along with provided assessments by the instructor, you will be eligble to get certificate of course completion.
For how long can i access my course on the platform?
You require an active subscription to access courses on our platform. If your subscription is active, you can access any course on our platform with no restrictions.Is there any free trial?
Currently, we do not offer any free trial.Can i cancel anytime?
Yes, you can cancel your subscription at any time. Your subscription will auto-renew until you cancel, but why would you want to?
Instructor

380921 Course Views
10 Courses


 Tech & IT
 Business
 Coding & Developer
 Finance & Accounting
 Academics
 Office Applications
 Art & Design
 Marketing
 Health & Wellness
 Sounds & Music
 Lifestyle
 Photography


